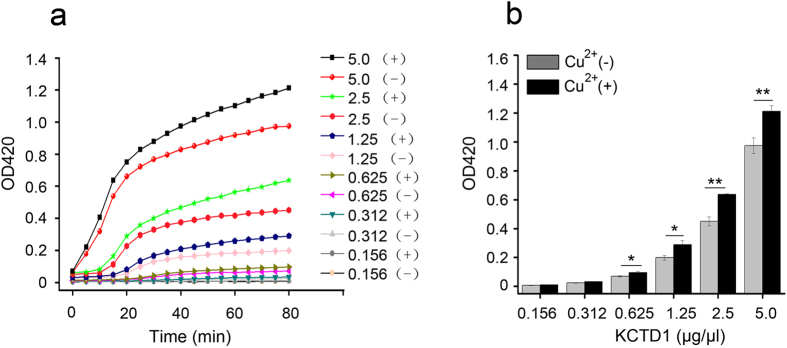
Figure 3. KCTD1 aggregates in vitro in a concentration-dependent manner using the turbidity assay.
(a) Time-course aggregation of different KCTD1 concentrations (0.156−5.0 μg/μl) at pH 7.0 and 37 °C, in the presence (+) of 20 μM Cu2+, and in the absence (−) of 20 μM Cu2+. (b) The turbidity of different KCTD1 concentrations (0.156−5.0 μg/μl) were monitored in the presence (+) or absence (−) of Cu2+ after incubation for 80 min. The data shown were the mean ± s.d. of 3 independent experiments. *P < 0.05; **P < 0.01; t-test.

