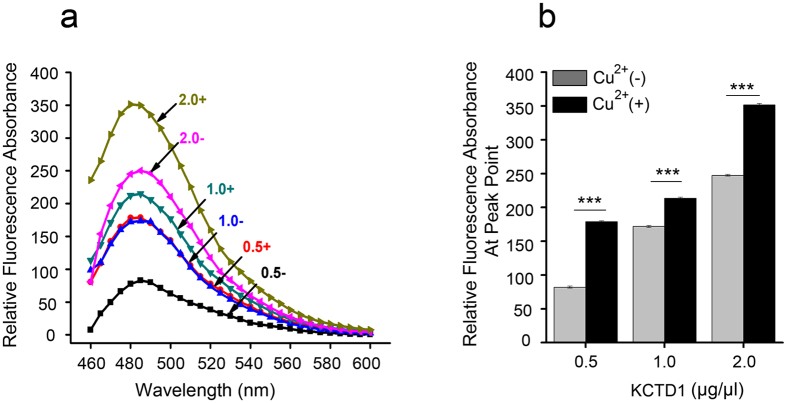
Figure 4. Thioflavin T binding analysis indicates that Cu2+ promotes fibrillar aggregation of KCTD1.
KCTD1 concentrations of 0.5−2.0 μg/μl were incubated for 2 h (pH 7.0) in the presence (+) or absence (−) of 20 μM Cu2+. (a) Fluorescence spectra of KCTD1 with ThT. (b) Peak values of the spectra at different KCTD1 concentrations with ThT. The data shown were the mean ± s.d. of 3 independent experiments. ***P < 0.001; t-test.

