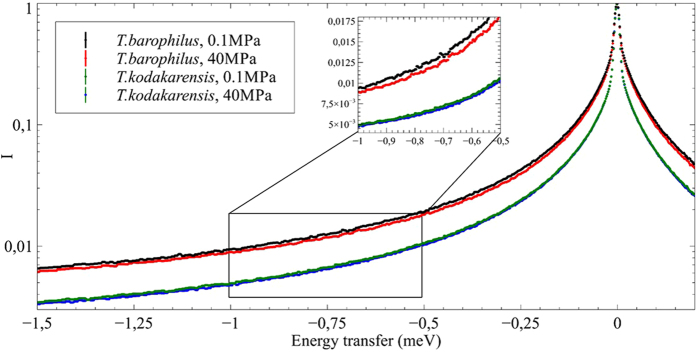
Figure 2. Normalized spectra averaged over all scattering angles for both samples at ambient pressure and at 40 MPa.
The insert is a magnification of the energy transfer domain between −1. and −0.5 meV highlighting the differences of the curves observed between T. barophilus and T. kodakarensis samples, and between T. barophilus samples under 0.1 and 40 MPa.

