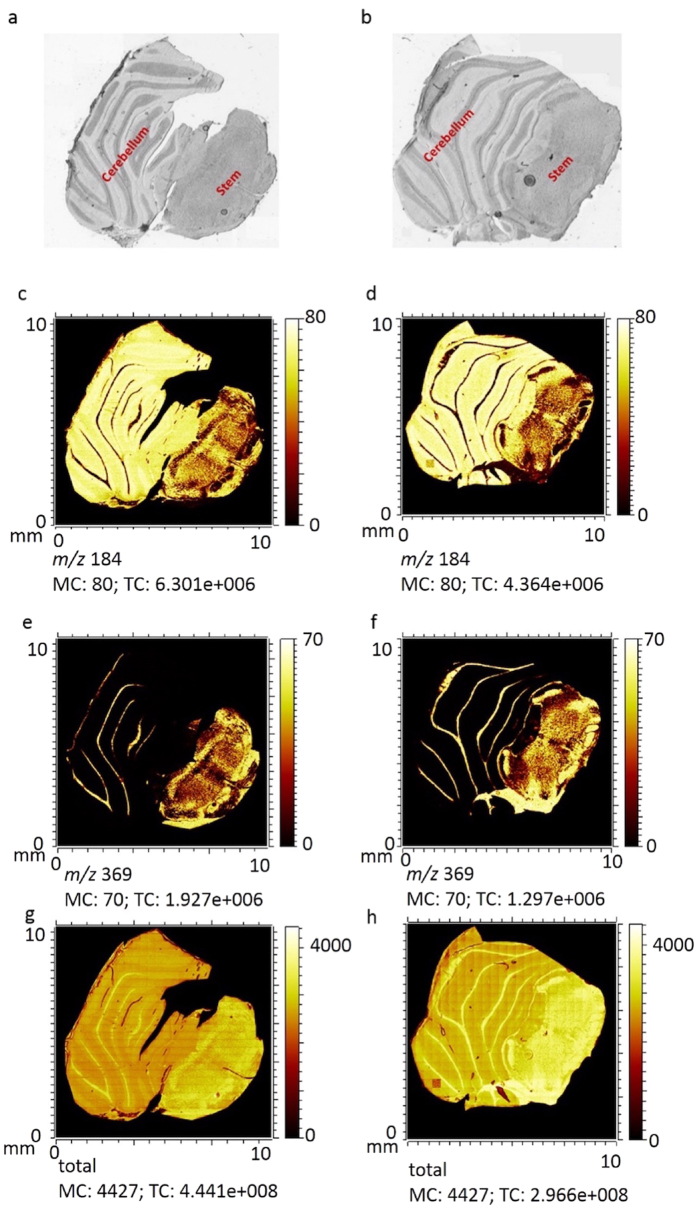
Figure 1.
Optical microscopy images of freeze-dried rat brain sections brain section containing cerebellum and stem are shown in (a) control and (b) the SPC-fed group. ToF-SIMS images showing the spatial signal intensity distribution from positive ions are shown for m/z 184 (phosphocholine): (c) control and (d) the SPC-fed group; for m/z 369 (cholesterol): (e) control and (f) the SPC-fed group; and for total ions: (g) control and (h) the SPC-fed group; across an analysis area of 11 × 11 mm covering the complete tissue.

