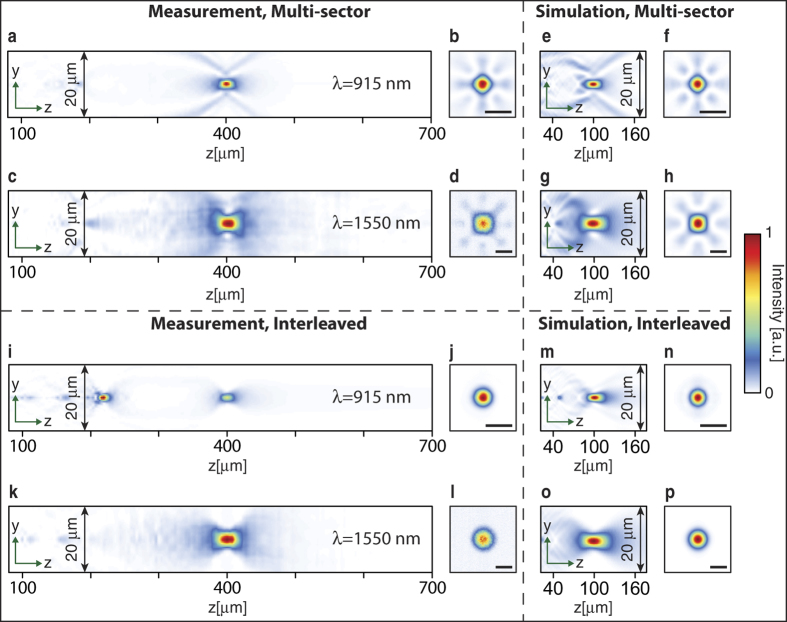
Figure 6. Measured and simulated intensity profiles.
(a) Intensity measured in the axial plane and (b), in the focal plane at 915 nm for the multi-sector lens. (c,d) Same measurements as (a,b) at 1550 nm. The high frequency intensity fluctuations observed in the measured focal intensity at 1550 nm is caused by the high non-uniformity in the responsivity of pixels in the phosphorous coated CCD used in 1550 nm measurements. This nonphysical fluctuation is filtered for the axial plane plots to acquire a smoother distribution. (e–h) FDTD simulated intensities for a similar multi-sector lens with a four times smaller size and focal distance. (i–l) Similar results to (a–d), but for the interleaved lens. (m–p) FDTD simulated intensities for a four times smaller interleaved lens. Scale bars: 4 μm.

