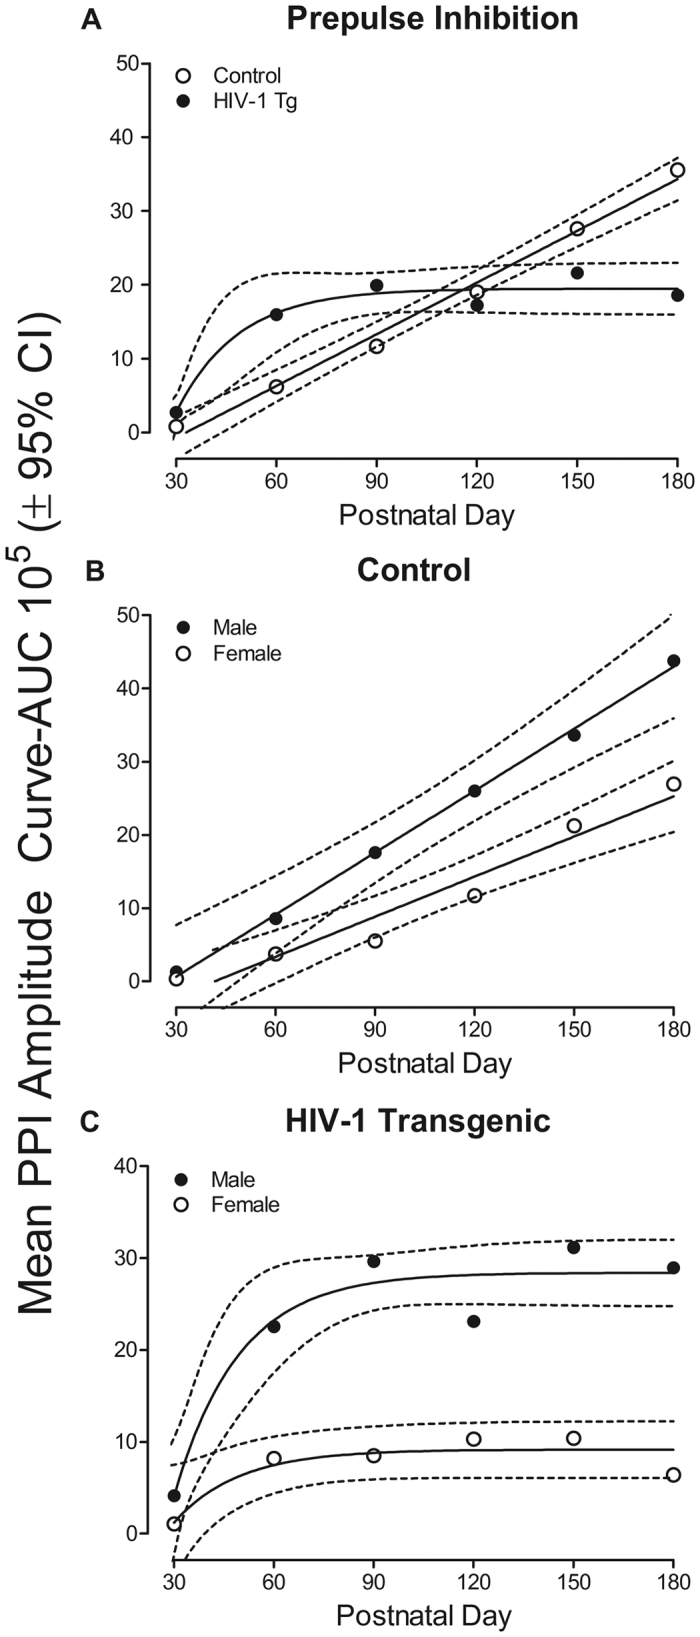
Figure 2.

(a) Prepulse inhibition, assessed using mean area of the peak inflection, is illustrated as a function of genotype (HIV-1 Tg or Control) and age (±95% CI). As age increases, control animals exhibit an linear increase in prepulse inhibition. Prepulse inhibition for HIV-1 Tg animals, however, was best fit using a one-phase association. Although control animals develop increased prepulse inhibition across age, HIV-1 Tg animals failed to exhibit an increase in prepulse inhibition after PD 90. Linear regression fit (R2): HIV-1 Tg, 0.96; Control, 0.99. (b) Prepulse inhibition for control animals is illustrated as a function of sex (Male or Female) and age (±95% CI). A first-order polynomial was fit to both male and female control animals. Although a linear increase prepulse inhibition was exhibited by both male and female control animals, there was a significant difference between groups in the rate at which prepulse inhibition increases [F (1,230) = 4.3, p ≤ 0.04]. Linear regression fit (R2): Male, 0.99; Female, 0.95. (c) Prepulse inhibition for HIV-1 Tg animals is illustrated as a function of sex (Male or Female) and age (±95% CI). Prepulse inhibition for both male and female HIV-1 Tg animals was best fit using a one-phase association. Female HIV-1 Tg animals displayed significantly less prepulse inhibition than male HIV-1 Tg animals. Linear regression fit (R2): Male, 0.92; Female, 0.82.
