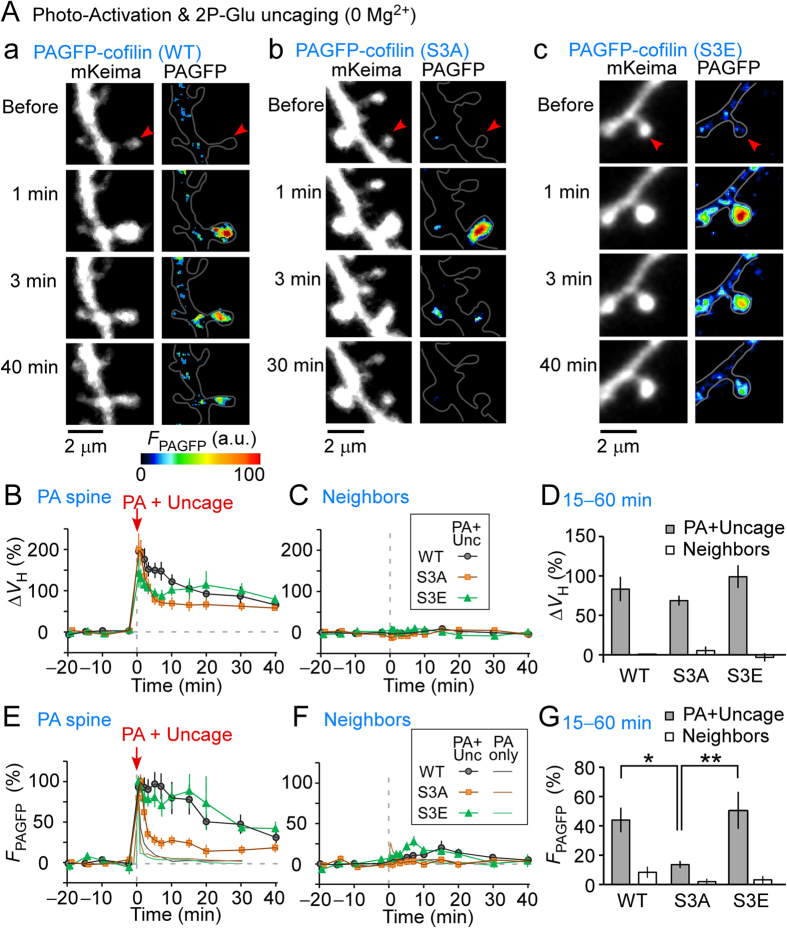
Figure 2. Spreading of cofilin along dendrites during spine enlargement.
Spine enlargement was induced by repetitive glutamate uncaging (0.6 ms, 5 Hz, 80 times), in which incidental light activated the photoactivatable green fluorescent protein (PAGFP)-cofilin fusion proteins. (A) Images of dendrites expressing mKeima and PAGFP-cofilin (A-a), PAGFP-(S3A) cofilin (A-b), and PAGFP-(S3E) cofilin (A-c). Red arrowheads mark an individual stimulated spine. (B,C) Time course of spine enlargement in stimulated, photoactivated (PA) (B) and neighboring (C) spines expressing either wild-type (WT) PAGFP-cofilin (nine dendrites), PAGFP-(S3A) cofilin (ten dendrites), or PAGFP-(S3E) cofilin (six dendrites). (D) Amplitudes of spine enlargement in PA and neighboring spines at 15–60 min after uncaging. There were spine volume changes of 83% ± 15%, 69% ± 6.2%, and 99% ± 14% of WT (nine dendrites), S3A (ten dendrites), and S3E (six dendrites), respectively, (stimulated spine, p > 0.1). (E,F) Time course of PAGFP fluorescence in stimulated (E) and neighboring (F) spines, expressing WT PAGFP-cofilin, PAGFP-(S3A) cofilin, or PAGFP-(S3E) cofilin. The results of ‘no uncaging’ controls were superimposed (thin lines) when PA was performed ten times without caged glutamate for 1 ms at 5 Hz, repeated twice with a 10 s interval (Fig. 1). (G) Fluorescence intensities of PAGFP in PA and neighboring spines at 15–60 min after uncaging. A difference in residual intensities of FPAGFP between WT, S3A, and S3E of stimulated spines at 15–60 min after uncaging was evident (44% ± 8.4%, and 14% ± 2.4%, and 51% ± 13% for WT, S3A, and S3E, respectively) (p < 0.05 vs. WT and p < 0.01 vs. S3E). In contrast, no difference was observed between neighbors that showed little enlargement. Error bars represent the mean ± SEM.

