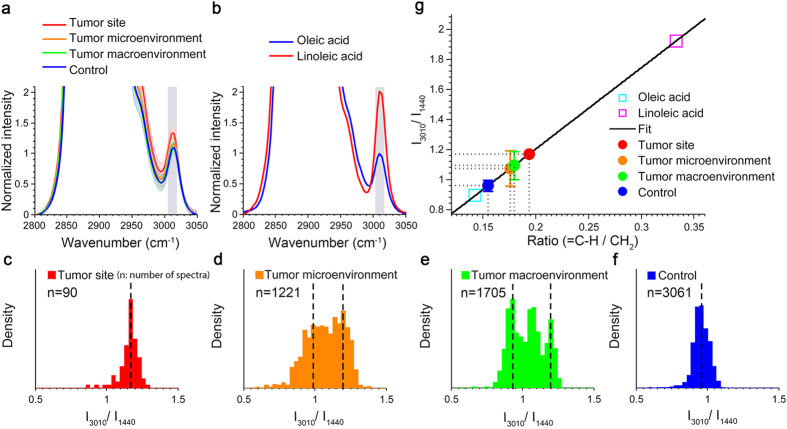
Figure 1. PUFA levels increase in the tumor site, tumor microenvironment and tumor macroenvironment of tumor-bearing rats, compared with healthy mammary tissue from control group.
(a) Comparison of average Raman spectra of fatty acids in the mammary tissue from tumor-bearing rats, and healthy mammary tissue from control rats. Shaded curves show the corresponding standard deviations of all spectra acquired from each group. The major peak used for quantifying the degree of unsaturation is marked with shaded vertical bands (3010 cm−1). (b) Raman spectra of two pure reference fatty acids (oleic acid and linoleic acid) in the CH region from 2800 cm−1 to 3050 cm−1. (c–f) Density distributions of the level of unsaturation of fatty acids from four different groups (5 rats in each group): tumor, tumor micro- and macroenvironments, and control (no treatment group). (g) Quantitative analysis of  of fatty acids in each tissue sample. TheRaman measurements of the extracted fatty acids from tissue (I3010/I1440) were fitted on the linear model to predict the molecular structure (
 ). Error bars indicate the measurement standard deviations.

