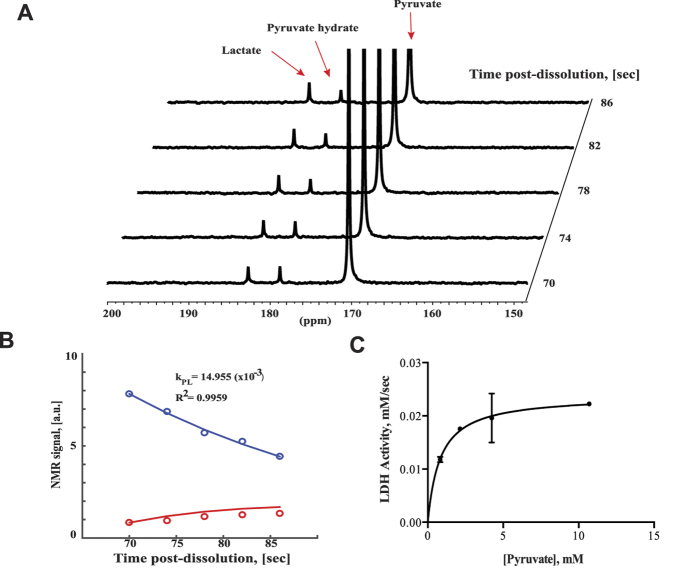
Figure 2.
(A) Dynamic spectra of a solution 4 mM hyperpolarized pyruvate and 0.4 U of LDH enzyme sampled every 4 s with a 10° flip angle. Visible resonances are pyruvate (171 ppm), pyruvate hydrate (178 ppm) and lactate (182 ppm). (B) Integrals of the resonances were fit to a model to extract rate constants, where pyruvate (blue) decays over time while lactate (red) increases. (C) Different pyruvate concentrations (0.82–10.7 mM, n = 3 each concentration) were used to determine the kinetics of LDH.

