
Figure 10. Kinetic phase diagram under the effect of a fast translocating compound.
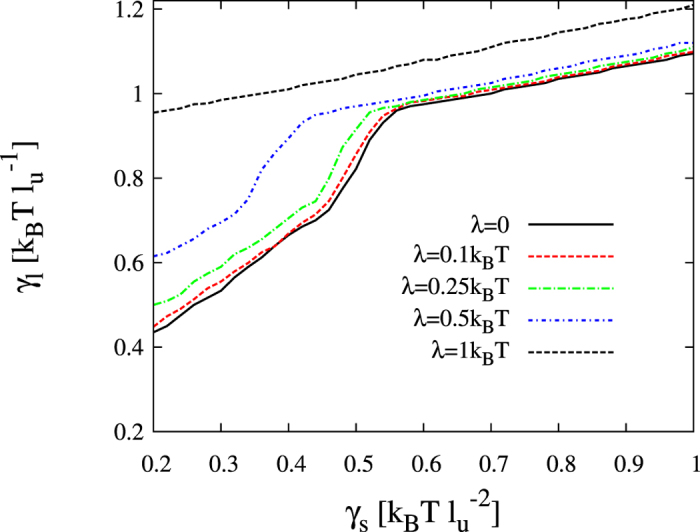
Modification of the kinetic stability diagram boundary  for different values of the affinity parameter λ. The region below (above) the boundary corresponds to the registration (antiregistration) regime in the numerical simulations.