
Figure 3. Transversal behavior of added compounds.
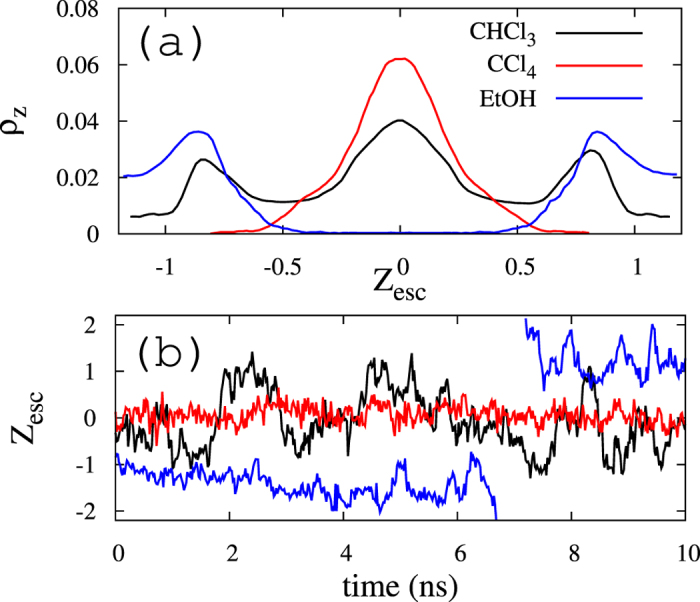
(a) Chloroform, carbon tetrachloride and ethanol density distribution probabilities in the z-axis (normal to membrane surface), ρz. The profiles are plotted in a scaled distance with respect to the bilayer center, Zesc, where the position of the opposite phosphate beads are fixed to Zesc = ±1. (b) Representative trajectories of chloroform, carbon tetrachloride and ethanol molecules tracked for a 10 ns period of time in the DUPC/DSPC/Chol membrane system.