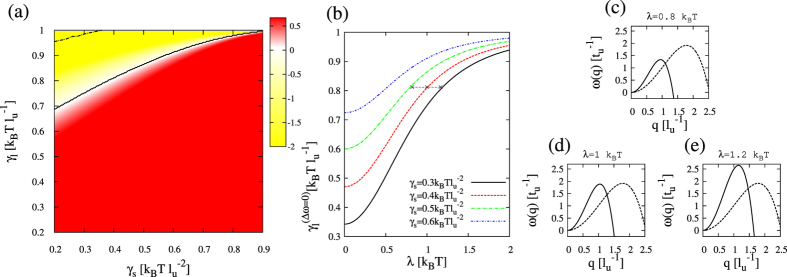
Figure 5. Kinetic diagram and growth rate behavior in the presence of a fast translocating compound.
(a) Kinetic stability (γs, γl) diagram for a segregating membrane in the presence of a rapidly translocating compound (Dc = 10, λ = 1). The other model parameters are fixed to α = 2, γ = 1,  and
and  . Yellow (red) indicates the parameter region where the antiregistration (registration) modes dominate the initial demixing stages. The solid curve stands for
  whereas the dot-dashed curve corresponds to the boundary between registered and antiregistered regimes directly computed from numerical simulations,
  (more details in Fig. 10). (b) Dependence of
  with the coefficient λ at different values of γs. (c–e) Illustrative growth rates ωR(q) (solid) and ωAR(q) (dashed) corresponding to panel (b) for γs = 0.4,
  and different values of λ traversing the kinetic boundary (see horizontal dashed line in panel (b)).

