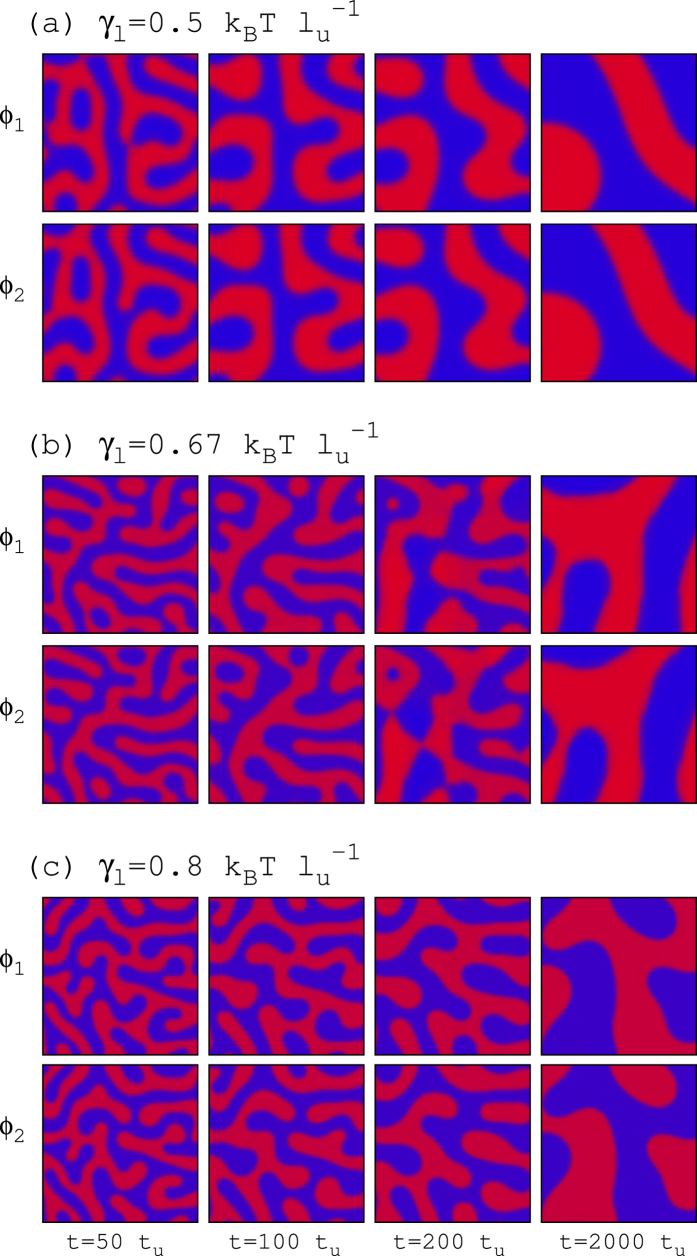
Figure 6. Evolution of registered and antiregistered segregation patterns in unperturbed bilayers.
Temporal sequence of the lipid composition at both layers obtained from simulations of pure lipid bilayer systems (λ = 0) for γs = 0.4 and different values of γl. Blue and red colors stand for ϕ(Ld) and ϕ(Lo) segregating phases, respectively. The linear size of the system is 100 lu.

