
Fig. 3.
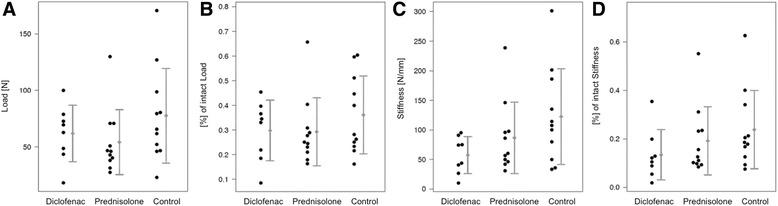
Biomechanical values as means ± SD and dotplot of (a) breaking load and (b) % of intact load, (c) stiffness and (d) % of intact stiffness. Mean differences and significances are shown in Table 1
Official websites use .gov
A
.gov website belongs to an official
government organization in the United States.
Secure .gov websites use HTTPS
A lock (
) or https:// means you've safely
connected to the .gov website. Share sensitive
information only on official, secure websites.
Biomechanical values as means ± SD and dotplot of (a) breaking load and (b) % of intact load, (c) stiffness and (d) % of intact stiffness. Mean differences and significances are shown in Table 1