
Fig. 3.
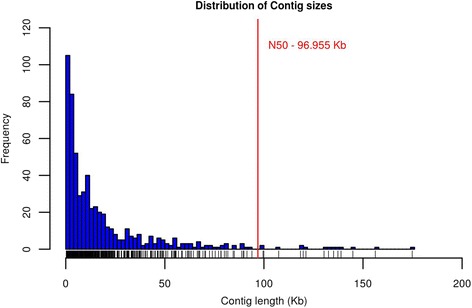
Distribution of frequencies of misassembled contig sizes. The red line represents the N50 of the UMDv3.1 bovine genome assembly
Official websites use .gov
A
.gov website belongs to an official
government organization in the United States.
Secure .gov websites use HTTPS
A lock (
) or https:// means you've safely
connected to the .gov website. Share sensitive
information only on official, secure websites.
Distribution of frequencies of misassembled contig sizes. The red line represents the N50 of the UMDv3.1 bovine genome assembly