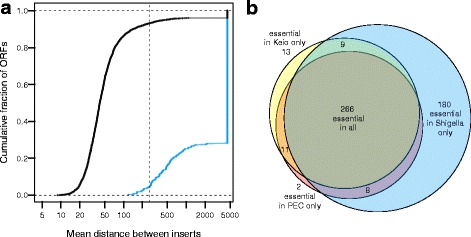
Fig. 3.

Differences in essentiality classification between E. coli K12 and Shigella. a Cumulative distributions showing the mean distances between inserts for ORFs depending on whether their orthologues are known to be non-essential (black curve) or essential (blue curve) in E. coli. All ORFs that are completely uninterrupted by transposons have been plotted at the very right end of the x-axis. The dotted vertical line indicates the cut-off that we used to delineate essentiality in Shigella (a mean distance between transposons of 260 bp or more). The 11 blue points to the left of the dotted vertical line indicate ORFs that are essential in E. coli but not Shigella by our metric. These are likely to be false negatives (i.e. essential in both Shigella and E. coli), as all have inter-insert distances greater than 100 bp (see main text). Black points to the right of the dotted vertical line indicate ORFS that we classify as essential in Shigella but not in E. coli. Many of these ORFs have E. coli orthologues whose deletion genotypes exhibit robust growth, suggesting that their essentiality status has changed. b A Venn diagram showing the overlap between essential orthologous ORFs in E. coli and Shigella
