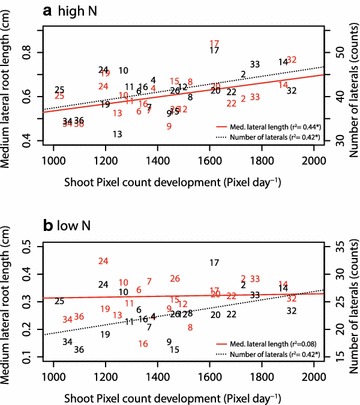
Fig. 5.

Correlation of shoot pixel count development (Pixel day−1) expressed as the slope best fitting the linear model and medium lateral root length (cm) or the number of lateral roots (counts) either under high N (a) or low N conditions (b). Significance levels: ≤0.001***, ≤0.01**, ≤0.05*. Correlation was done based on best linear unbiased predictors (BLUPS). The standard error of the difference was 323 pixels for the shoot and 0.1 cm for the lateral root length under high as well as under low N conditions
