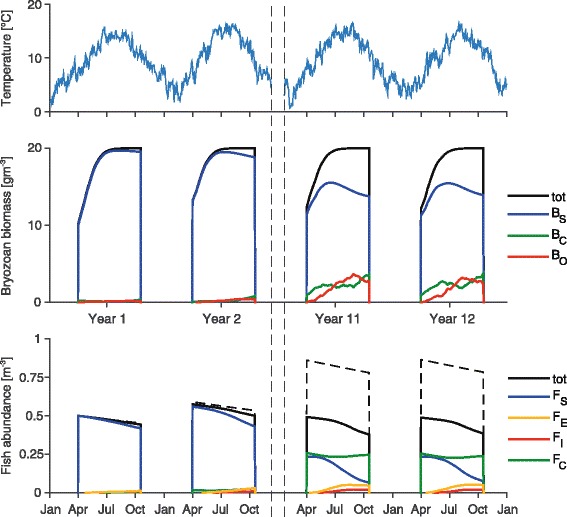
Fig. 3.

Model simulation. Evolution of the state variables of model (1) and (4) in a 12-years-long simulation. Seasons start on April 1 and last for 200 days. Black solid lines represent the time evolution of the overall bryozoan and fish populations; the dashed line indicates fish abundance if PKD is absent. Initial condition: B S = 0.495ρ -1, B C = 0.005ρ -1, F S = 0.99ξ -1, F C = 0.01ξ -1; other state variables are null. Temperature-dependent parameters are taken from Fig. 2; other parameters are set to their reference values (reported in Table 3). The water temperature time series used for the simulation is reported in the top subplot
