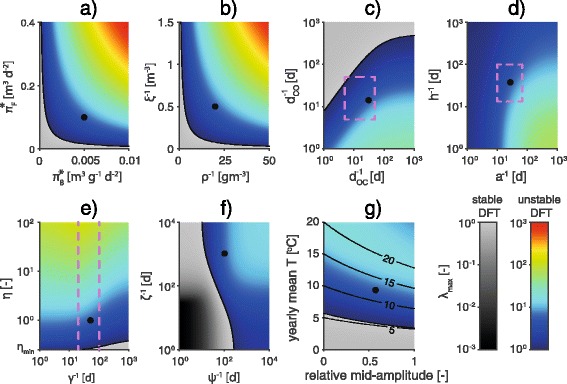
Fig. 5.

Sensitivity analysis: Parasite invasion. Values of λ max as a function of model parameters π B * vs. π F * (a); ρ vs. ξ (b); d OC vs. d CO (c); a vs. h (d); γ vs. η (e); ψ vs. ζ (f); temperature (g). Pink dashed lines identify feasible parameter ranges. Black dots refer to the reference parameter set. For the sake of clarity, all rates are expressed as mean times (i.e. by their inverse). With regards to temperature-dependent parameters, their value at 15 °C is displayed. Black solid lines in g identify levels of mean temperature during the warm season
