
Fig. 1.
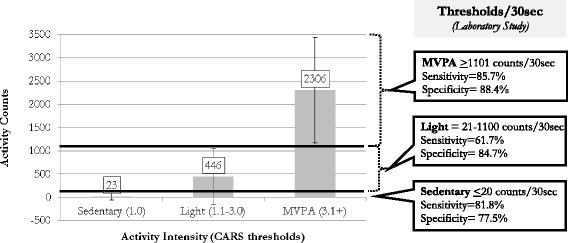
Activity Counts by Intensity (Laboratory Study). The bar graph represents the means (± standard deviations) of accelerometer activity counts by intensity. Bolded lines indicate thresholds designated for sedentary/light and light/MVPA with the sensitivity and specificity of thresholds presented in the right panel