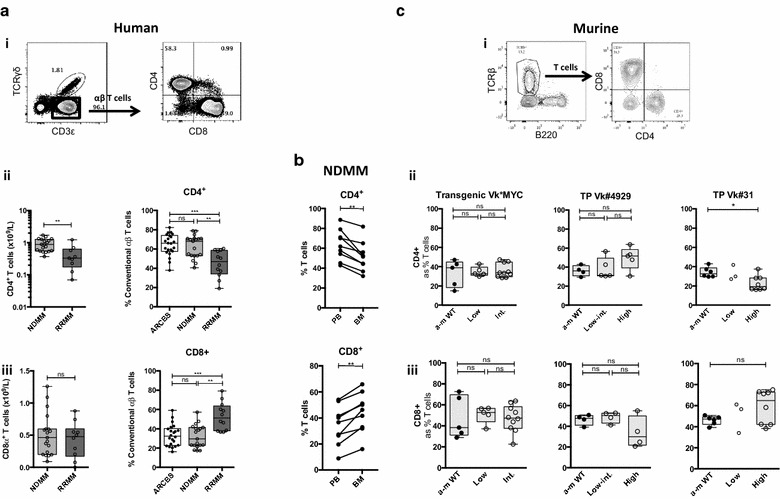
Fig. 3.

CD4+/CD8+ T lymphocyte analysis in human MM and Vk*MYC mouse models. a Human PBMC CD4+/CD8+ T lymphocyte analysis. (i) FACS plots showing representative staining: CD4+/CD8+ T cells are expressed as % αβ T cells (CD3ε+ TCRγδ− events). (ii–iii) Box and whisker plots showing (ii) CD4+ T cells and (iii) CD8+ T cells as an absolute number (left) and as a proportion of αβ T cells (right). Clear boxes ARCBS donors, light grey boxes NDMM, dark grey boxes RRMM. b Human T lymphocyte matched pair analysis of PBMC and BMMC samples in NDMM (as described for a). c Murine BMMC CD4+/CD8+ T lymphocyte analysis in Vk*MYC mouse models. (i) FACS plots showing representative staining: CD4+/CD8+ T cells are expressed as % T cells (TCRβ+B220− events). (ii–iii) Box and whisker plots showing (ii) CD4+ T cells (iii) CD8+ T cells. (Left) Transgenic Vk*MYC (middle) Transplant Vk#4929, (right) Transplant Vk#31. Closed circles represent a-m WT, open circles represent diseased mice [which are subdivided into low, intermediate (int.) or high-grade disease as described in Fig. 2a]
