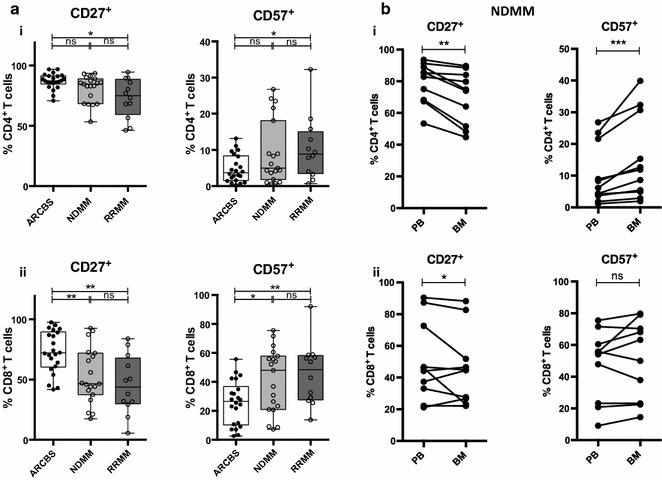
Fig. 6.

CD27/CD57 expression analysis in human MM. a Human PBMC CD4+/CD8+ T cell analysis of CD27 and CD57 expression. Box and whisker plots showing % CD27+ (left) and % CD57+ (right) of (i) CD4+ T cells and (ii) CD8+ T cells. Clear boxes ARCBS donors, light grey boxes NDMM, dark grey boxes RRMM. b CD27 and CD57 expression matched pair analysis in PBMC and BMMC from NDMM patients (as described in a). (i) CD4+ T cells (ii) CD8+ T cells
