
Fig. 5.
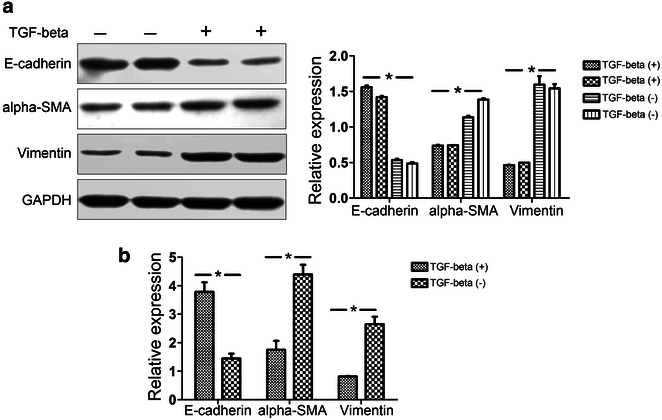
The protein and mRNA levels of E-cadherin, α-SMA, and vimentin were quantified by Western blot and qPCR analyses on TGF-β1 induced EMT in HEC-1-A cells. a The results of Western blot. (left data from the gels; right normalization to GAPDH) (n = 6 per group) (*P < 0.05). b The results of qPCR (n = 6 per group) (*P < 0.05)