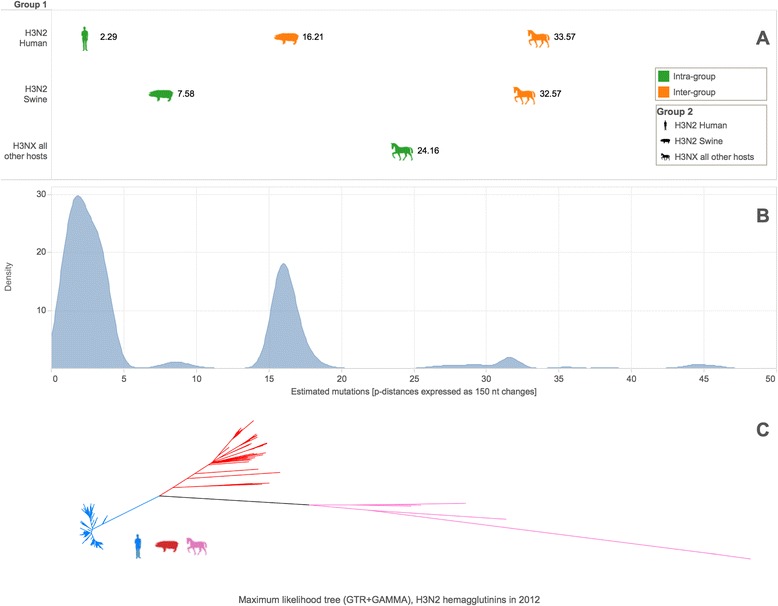
Fig. 2.

Genetic diversity of 1097 influenza A(H3) hemagglutinins collected in 2012. a Upper triangle of the host group-to-group average pairwise distance matrix plotted on and expressed as the number of estimated mutations per 150 nucleotides. b Density plot for the upper triangle of the pairwise distance matrix over all sequences, plotted and expressed on the same scale. c Maximum likelihood phylogenetic tree of H3 HA sequences with labeling by host group color
