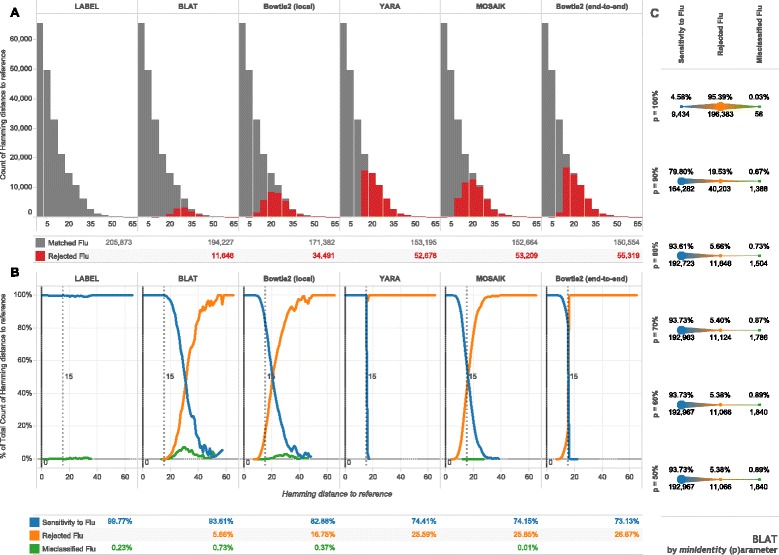
Fig. 3.

Sensitivity to influenza biological diversity. For each influenza type, subtype, and gene segment—39 alignments in all—randomly chosen subsequences of fixed length (150 nucleotides) were matched against alignment consensuses with programs shown. Hamming distance is the number of mismatching nucleotides between subsequences and references. a Histograms, with binning width 5, give the count of the subsequences matched to a flu consensus sequence or not. b Line plots show normalized frequencies at each un-binned hamming distance and further characterize matched fragments into the proportion of misclassified fragments (matched to the wrong influenza consensus). Tabular summaries represent the total count or proportion for each method across all 205,873 subsequences. The dashed vertical lines represent the general limit of detection for non-statistical approaches. c The minimum identity parameter (p) for BLAT was varied on the same dataset with summary proportions and counts shown for each parameter value
