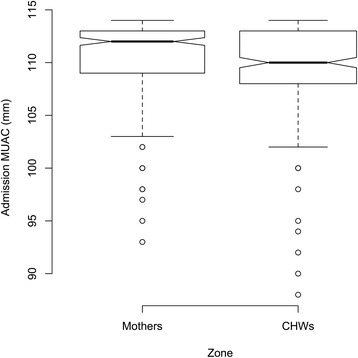
Fig. 3.

Distribution of MUAC at admission, children admitted for severe acute malnutrition treatment by MUAC <115 mm, in health zones where mothers or community health workers performed malnutrition screening, Mirriah District, Niger between June 2013 and May 2014. For the box plots presented in Fig. 3, the box extends between the upper and lower quartiles with the thicker line in the box marking the position of the median. The whiskers extend to 1.5 times the interquartile distance above and below the upper and lower quartiles. The isolated points mark the positions more extreme than the range of values covered by the whiskers. If the notches around the medians for each zone do not overlap then there is “strong evidence” that the two medians differ. [32]
