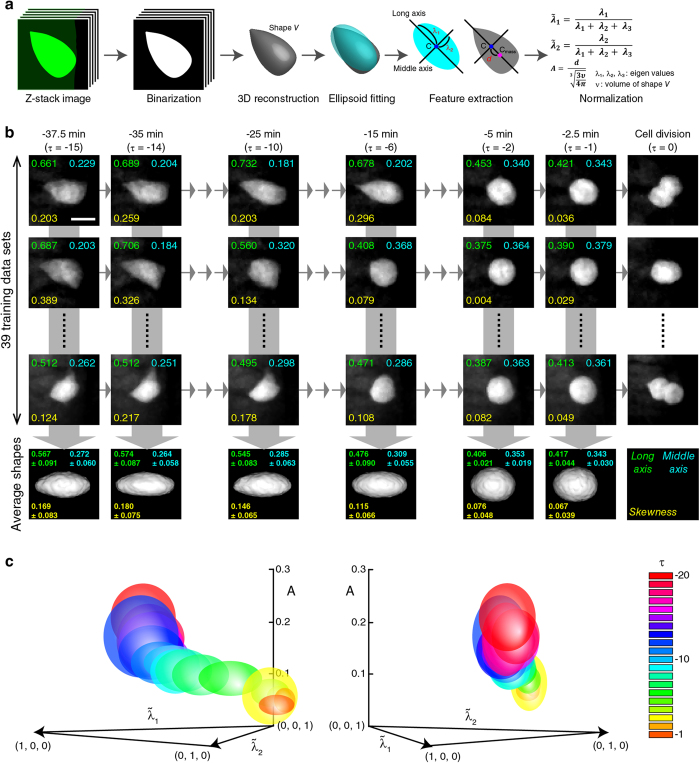
Figure 2. Quantitative shape features of V2 cells in relation to their division timing.
(a) Image processing and measurements of V2 cell-shape features. The short axis is not shown in the figure, but it points to the direction perpendicular to both long and middle axes. Though not shown in the figure,  is the normalized eigenvalue along the short axis. (b) Generation of probabilistic shape features of V2 cells at each time-point. Shape-features of each of the 39 cells at each time-point are shown. Average shapes based on the statistical modeling of the 39 shape-features are shown at the bottom for each time-point. Long axis (i.e.,
  ), Middle axis (i.e.,
  ), Skewness (i.e., A) values are indicated at the top left, top right, bottom left, in each panel, respectively. (c) Probabilistic distributions of shape-features at each time-point. Distributions for each time-point (τ = −20–−1 are color-coded and plotted on the 3D space (A,
  ) (see also “Quantitative characterization of cell-shape” section of Methods). Views from two different angles are shown.

