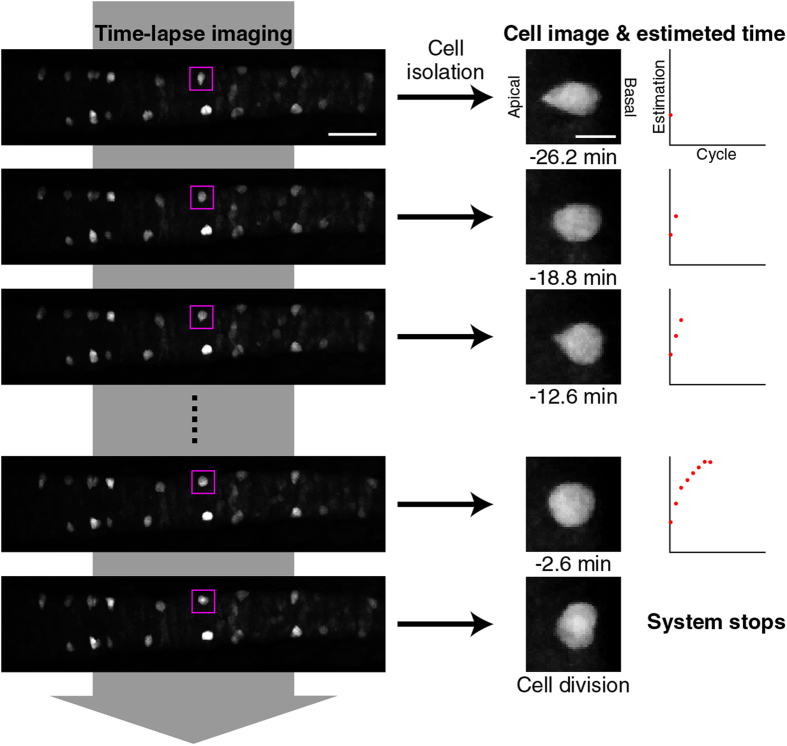
Figure 6. Real-time prediction system.
The method of real-time prediction is schematically shown. Here, the successive shape changes of the boxed GFP+ V2 cell (the left and middle columns) were tracked at 2.5 min intervals (middle column) and the remaining time to division was predicted using sequential Bayesian inference and plotted as dots (right column). See also “Real-time prediction of cell-division timing” section of Methods. Scale bars, 50 μm and 10 μm for the left and middle columns, respectively.

