
Figure 7.
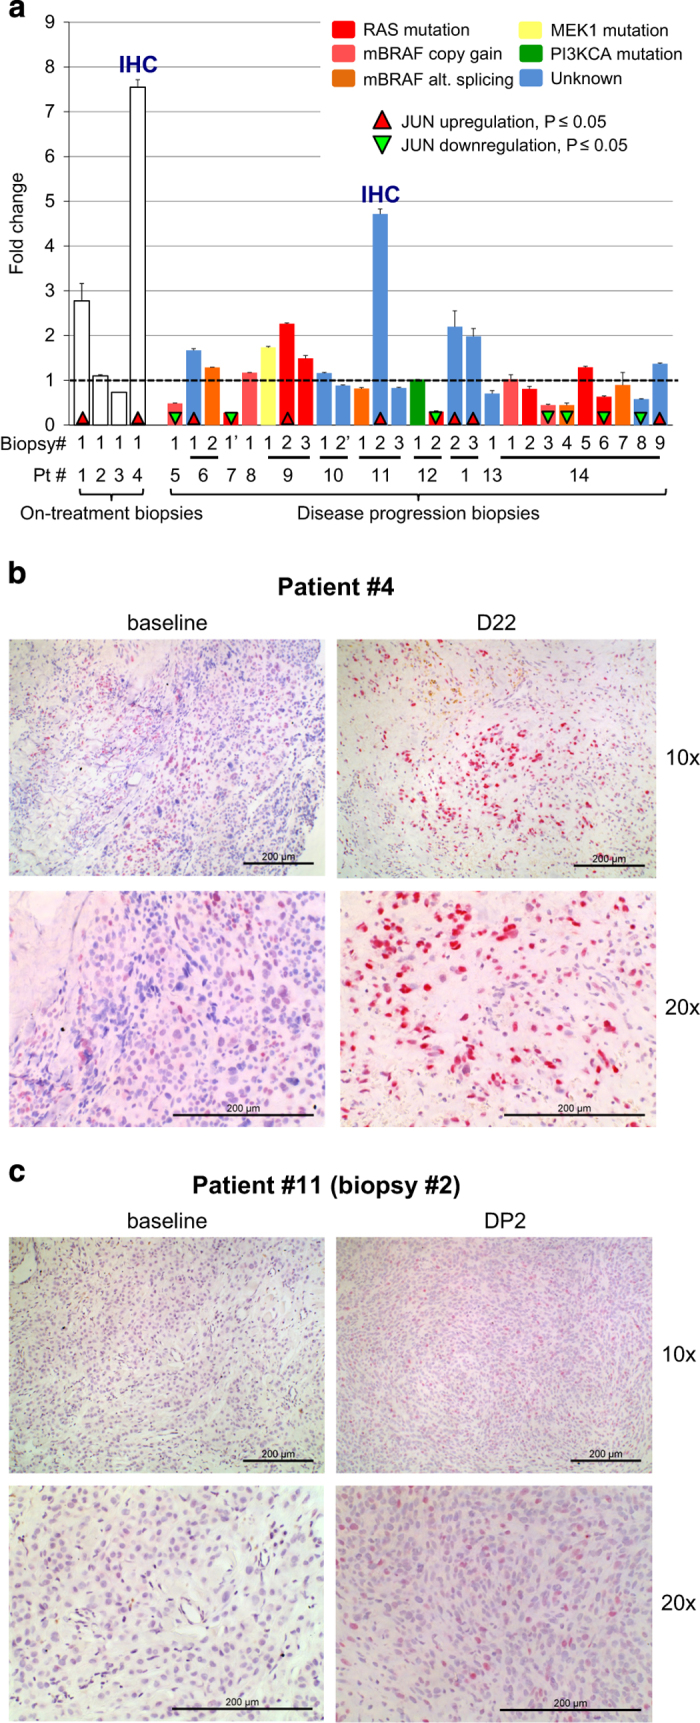
JUN upregulation is a common treatment response in melanoma patient samples (a) The occurrence of JUN upregulation on BRAFi treatment in mRNA expression data from 31 biopsies of 14 melanoma patients. The x-axis labels indicate patient (Pt) and biopsy numbers. Biopsy identification numbers with a quote symbol (‘) are from tumor(s) treated with BRAFi+MEKi dual inhibitor therapy. On the left are four on-treatment biopsies from four patients treated from 6 to 22 days, and on the right are disease progression (DP) biopsies annotated with their patient identification number (a total of 27 DP biopsies). The clinical details of the patients and the biopsied tumors are presented in Supplementary Table S9. mRNA expression was quantified by RNAseq except for Pt # 1, 13 and 14 for which exon-level microarray analysis was used. The JUN mRNA expression fold changes are computed with respect to each patient’s pre-treatment tumor JUN expression level. The JUN expression fold change for each patient is shown with error bars based on standard error of the mean (SEM) across replicates. Cases of statistically significant differential expression are indicated by up (red) and down (green) triangles. JUN was upregulated in two out of four on-treatment biopsies in two out of four patients and 6 out of 27 DP biopsies in 5 out of 11 patients. JUN was downregulated in 8 out of 27 biopsies in 4 out of 11 patients. DP biopsies from Pt #14 showed multiple cases of downregulation of JUN except for DP biopsy #9, indicating heterogeneous resistance mechanisms having a role [12]. Known genetic resistance mechanism identified in each sample are color coded as indicated in the key based on Shi et al. [12]. There is a slight enrichment of JUN upregulation in samples with an unknown resistance mechanism (Fisher’s exact test; P-value=0.095). (b, c) JUN immunohistochemistry staining of the on-treatment biopsy and the disease progression biopsy from a with substantial JUN mRNA upregulation. (b) patient #4; day 22 (D22) of kinase inhibitor treatment. (c) patient #11, biopsy #2, disease progression biopsy #2 (DP2). The respective baseline biopsies are also shown. JUN protein expression was visualized with a red chromogen. IHC, immunohistochemistry.