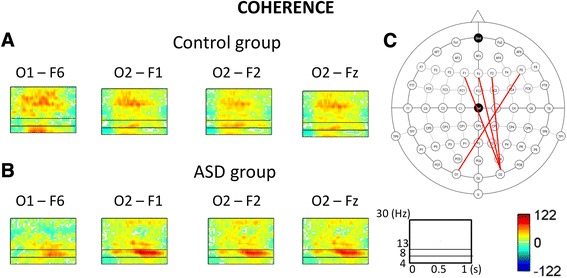
Fig. 2.

Time course of coherence averaged across all categories of names in the control group (a – upper panel) and in the ASD group (b – lower panel). Red lines in the scheme of the extended 10–20 system indicate significantly enhanced coherence (i.e. stronger connections) within the beta band in the control group in comparison to the ASD group (c). F – frontal electrodes; O – occipital electrodes. Odd numbers (e.g., F1) - electrodes located over the left side of the head; even numbers (e.g., F6) - electrodes located over the right side of the head; “z” (e.g. Fz) - electrodes located at the midline
