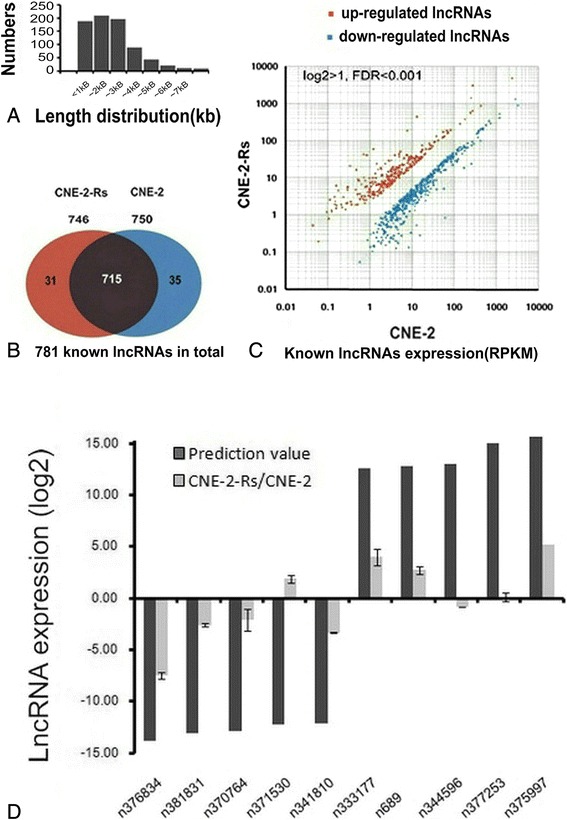
Fig. 2.

Overview of known lncRNAs associated with NPC radioresistance. a The length distributions of the transcripts. b The known lncRNAs identified in CNE-2 and CNE-2-Rs cells. The shaded area represented the lncRNAs found in both samples, and the areas coloured red and blue showed the number of lncRNAs expressed in samples CNE-2 and CNE-2-Rs, respectively. c Scatter plot of lncRNA expression profiles in radiosensitive CNE-2 (x-axis) and radioresistant CNE-2-Rs cells (y-axis). The significantly up-regulated lncRNAs were marked in red and the down-regulated lncRNAs in blue. |log2 Fold change| ≥ 1 and FDR < 0.001. d Validation of the expression levels of the top five up-regulated and down-regulated known lncRNAs via qRT-PCR
