
Fig. 5.
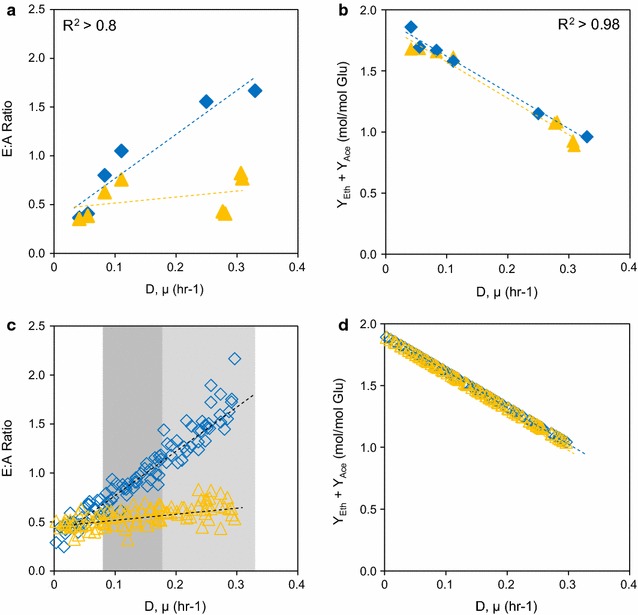
a Experimental data compilation of E:A ratios for cellulose (triangles) or cellobiose (diamonds). b Experimental data compilation of sum of ethanol and acetate yields from literature. c In silico implementation of E:A ratios. The shaded regions outline the points within the low growth, medium growth, and high growth sets. Symbols: cellulose (triangles) or cellobiose (diamonds). d In silico implementation of the sum of ethanol and acetate yields