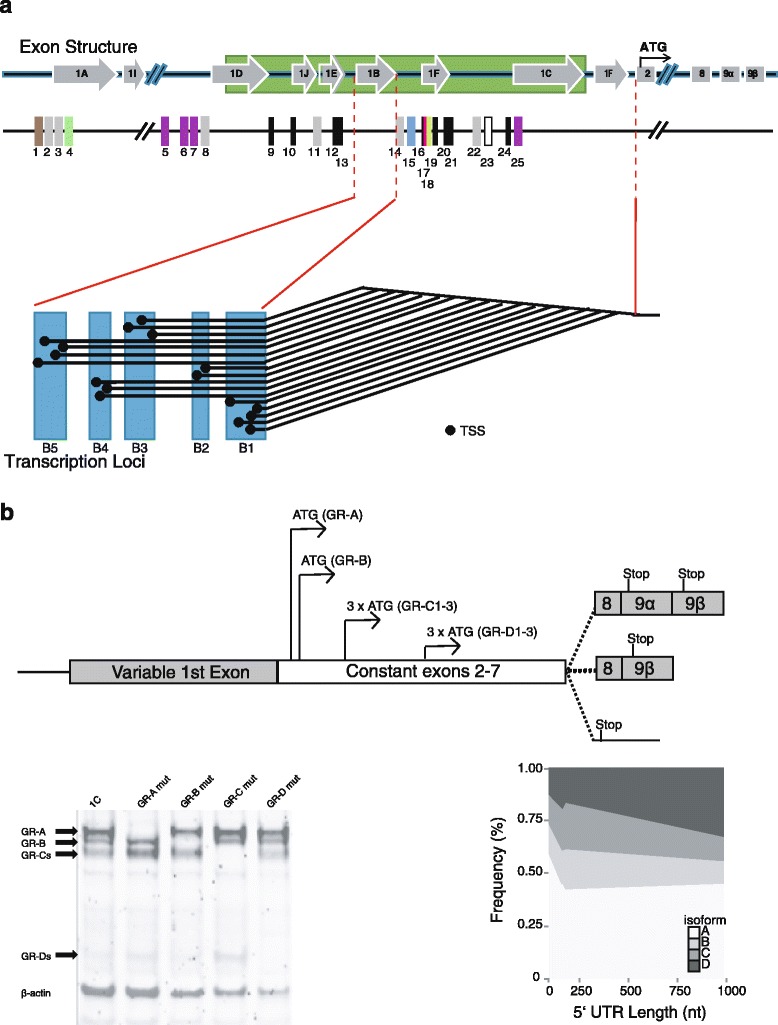
Fig. 2.

a A schematic representation of the NR3C1 5′ UTR structure, showing the alternative first exons (1A–1J, CpG island:  ), transcription factor binding sites (1–25), transcriptional loci (B1–B5), and microvariable transcription start sites (•). Transcription factor binding sites: (
 ) IRF-1 and IRF-2 (position 1); (
 ) glucocorticoid response elements (GRE, positions 2, 3, 8, 11, 14, and 22); (
 ) c-Myb, c-Ets1/2 and PU1 (position 4); (
 ) Ying Y and 1 (positions 5, 6, 7, and 25); (■) Sp1 binding sites (positions 9, 10, 12, 13, 16, 19, 20, 21, and 24); (
 ) Ap-1 (position 15); (
 ) NGFI-A binding site (position 17); (
 ) glucocorticoid response factor-1 (GRF-1, position 18); (□) Ap-2 (position 23). b Structure of the GR mRNA with the internal ATG translation initation codons, a western blot demonstrating the different transcriptional isoforms (from [113] with permission), and the frequency of the different protein isoforms with increasing 5′ UTR length (adapted from [111] with permission)
