
Fig. 2.
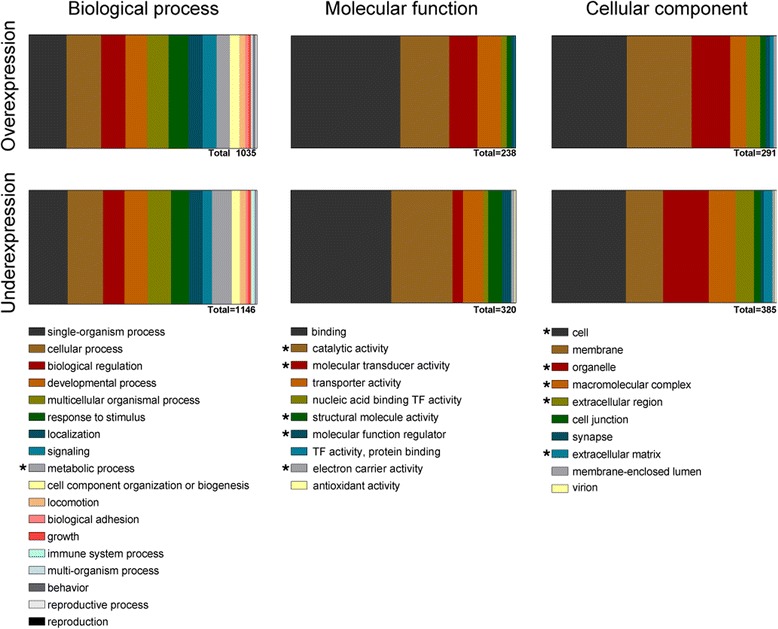
Gene ontology (GO) ID representations: (Biological process, Molecular function and Cellular component) for both over-expressed and under-expressed genes in the egg-spot tissue. Asterisks (in legend) denote significant differences in proportion of genes between the two datasets, as shown by chi-squared test (p-value < 0.05)