
Fig. 4.
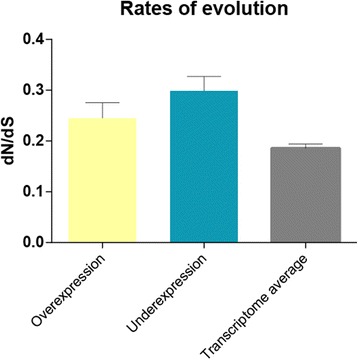
Rates of evolution (dN/dS) for the over-expressed genes (yellow bar), under-expressed genes (blue bar) and for a previously published dataset that estimated transcriptome-wide dN/dS values between cichlid species. No significant difference was detected between the over- and under-expressed dataset, although both had significantly higher dN/dS than the transcriptome average (as determined by t-test, p-value < 0.01). Error bars denote standard error of the mean