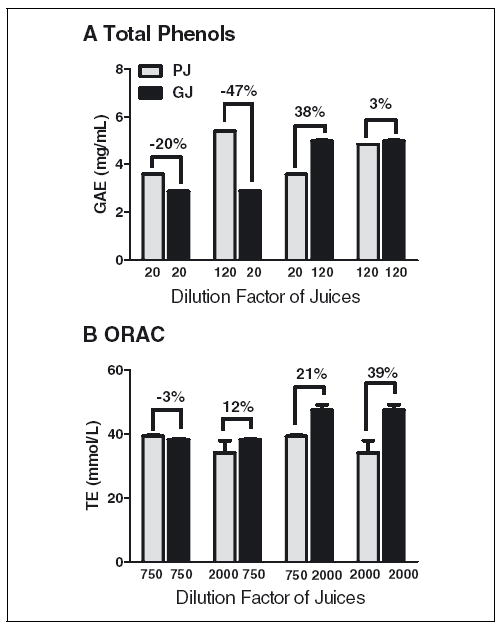
Figure 4.

The dilution factors employed in the assays had a significant effect on final TAC and TP values, (A) TP and (B) ORAC. Values between bars are the % difference of pomegranate juice. PJ, pomegranate juice; PNJ, pomegranate nectarine juice; GJ, grape juice. P-values for 2-tailed t-test comparisons for TP are P = 0.0003 for 20/20 DF; P < 0.0001 for 120/20 DF; P < 0.0001 for 20/120 DF; P = 0.0051 for 120/120 DF; and for ORAC are P = 0.5467 for 750/750 DF; P = 0.0016 for 2000/750 DF; P = 0.0799 for 750/2000 DF; P = 0.0446 2000/2000 DF.
