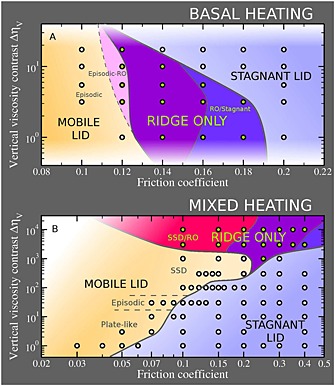
Figure 3.

Convective regimes obtained at statistical equilibrium for (top) basally heated and (bottom) mixed heated simulations. Black circles represent the simulations (circles filled green represent the RO regime). The background colors depict in more detail the regime boundaries obtained: orange and pink represent mobile lid, light blue represents stagnant lid, and darker colors stand for RO/mobile lid (red), RO regime (purple), and stagnant/RO regime (blue). White blending is used to emphasize the lack of data in certain areas. “SSD” stands for “Slow Stationary Downwellings” (see text).
