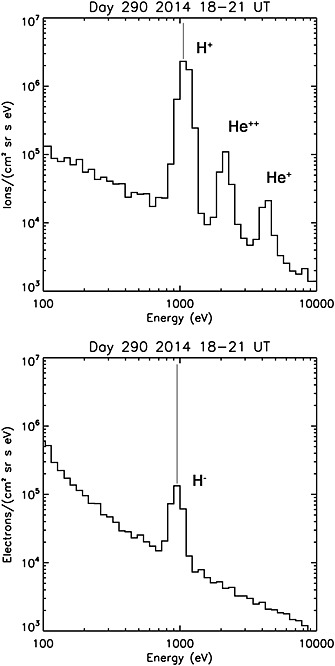
Figure 3.

Energy spectra for (top) positive ions and (bottom) negative particles. At increasing energies, the positive ion spectrum includes H+, He++, and He+, while the negative particle spectrum shows a single peak with a peak flux of about 5% of the proton flux, a total flux of about 10% of the proton flux, and a peak energy of about 90% of the proton energy peak (as noted in Figure 1).
