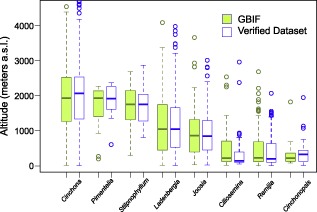
Figure 5.

Altitudinal range for each analysed genus in tribe Cinchoneae, using both the Verified and the GBIF datasets. Boxes indicate the interquartile range (IQ) of all estimates, with the median shown as a horizontal line and the whiskers indicating data range outside the quartiles. There were no significant differences between the ranges of any genus (Mann–Whitney U‐test; P > 0.05).
