
Figure 6.
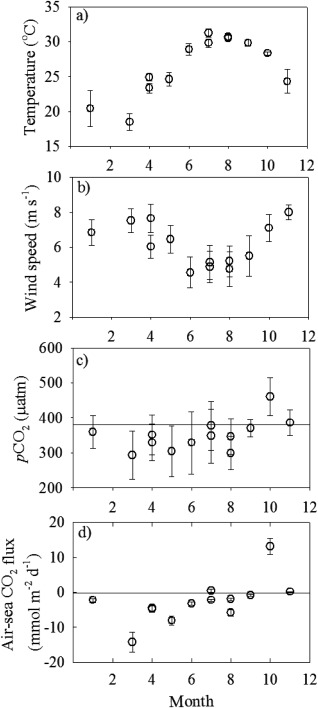
Seasonal variations of average (a) temperature, (b) wind speed, (c) sea surface pCO2, and (d) air‐sea CO2 flux in the reference area. The error bars in Figures 6a–6c showed ±1 standard deviation of each data point. In Figure 6, the bar showed the uncertainties of the data point. The line on Figure 6c represents the atmospheric CO2 value.