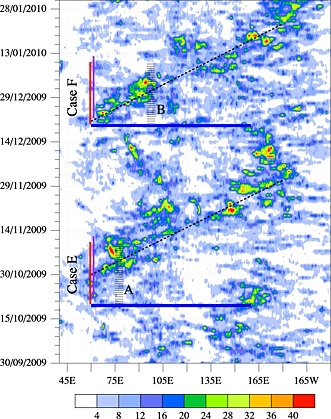
Figure 1.

Hovmoller plot of TRMM 3B42 daily rainfall averaged between 10°S and 10°N to show the YoTC MJO cases E and F. Dotted black lines mark the approximate phase propagation. Blue horizontal line marks the longitudinal extend of the requested data domain from models. Red vertical line shows the range of consecutive days on which models are initialized for the two MJO cases. The range of days at the end of each 48 h forecast is marked in purple line. Hatched regions indicate the longitude extent of two 5°x5° domains marked A (75°–80°E, 0°–5°N) and B (95°–100°E, 10°S‐5°S) used to characterize the evolution of convection from a suppressed state to convective state.
