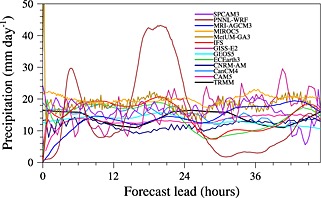
Figure 2.

Time step evolution of domain (75°–80°E, 0°–5°N) averaged precipitation as a function of forecast lead time for all the 22 forecasts for MJO case E. 48 h evolution of TRMM rainfall from each of the model initialization date are also shown as solid black line.
