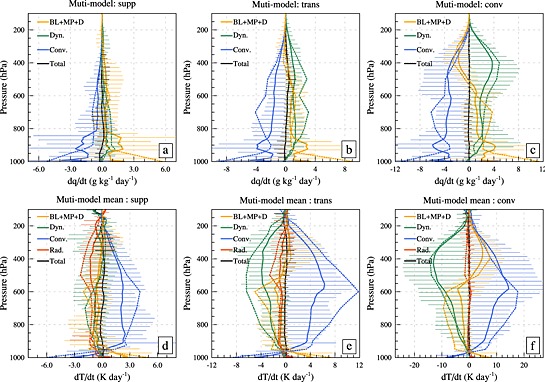
Figure 7.

Tendencies of specific humidity (a–c) due to convection, dynamics, and BL, microphysics, and diffusion combined during the 12–36 h forecasts. (d–f) The heating tendencies due to radiation, convection, dynamics, and BL, microphysics, and diffusion combined (BL + MP + D). Total tendencies are also shown. Multimodel means are plotted as solid lines and the range of model values (unlike the standard deviation in Figures 4 and 5 to span the full range of model behaviors) as whiskers. The tendencies from the ERA YoTC analysis is also plotted as dotted lines. Tendencies for suppressed (Figures 7a and 7d), transition (Figures 7b and 7e) and convective phases (Figures 7c and 7f) are shown. Please note the change of scale between panels.
