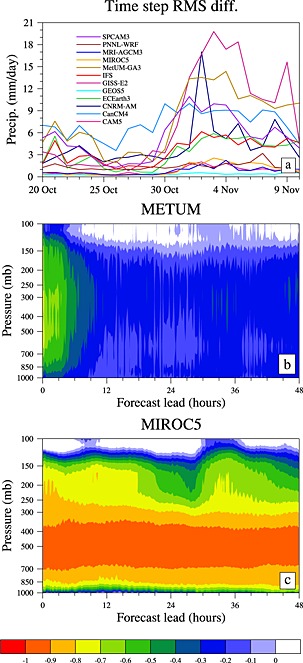
Figure 12.

(a) RMS difference between consecutive time steps of rainfall averaged over 75°–80°E, 0°–5°N for MJO case E. The pattern correlations between rainfall and ω at all vertical levels over 50°–90°E, 10°S–10°N (a convective region) at every model time step initialized on 3 November 2009 are shown to highlight the contrasting behaviors of models with (b) strong (MetUM) and (c) weak (MIROC5) time step intermittency of rainfall.
