Fig. 2.
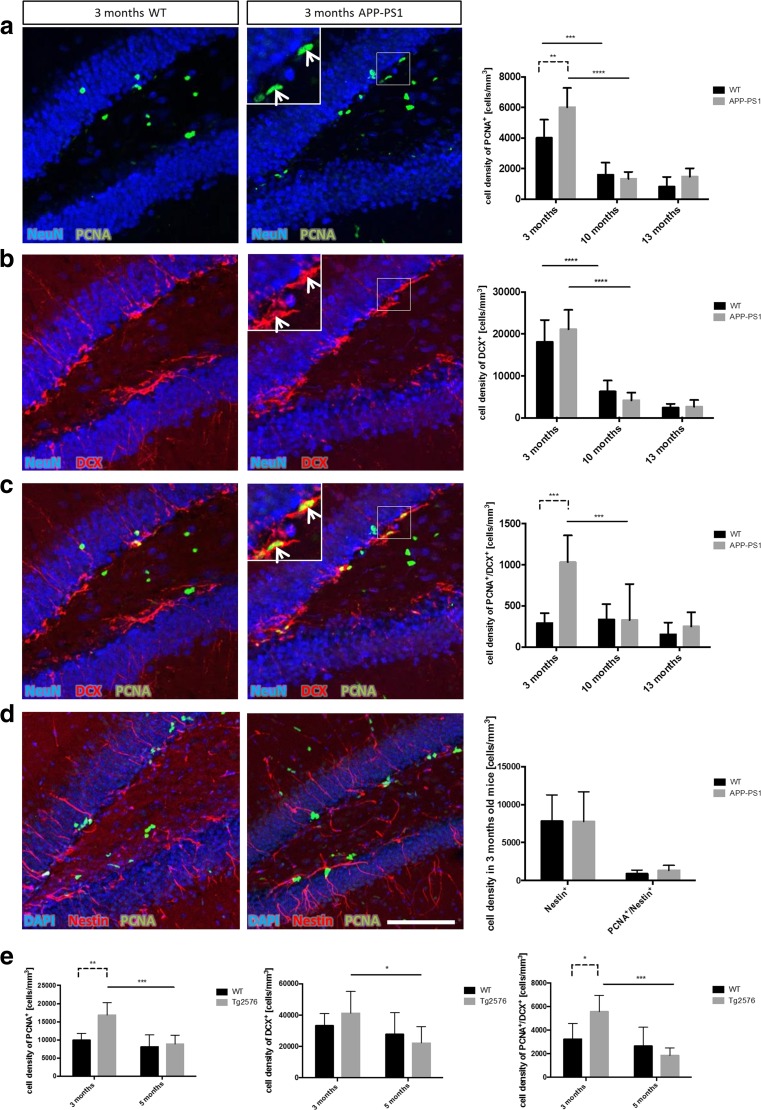
Hyperproliferation of immature DCX positive neuroblasts at early stages of Abeta pathology in transgenic animal models. Quantitative analysis of adult hippocampal neurogenesis in the GCL and SGCL of the dentate gyrus in APP-PS1 and Tg2576 mice was performed by immunohistochemical staining for proliferating cells (PCNA+), neuroblasts (DCX+) and proliferating neuroblasts (PCNA+/DCX+) at different time points of Abeta pathology progression. a While PCNA+ cells decrease with age from 3 to 10 months in both WT and TG, the 3-month-old APP-PS1 animals showed a significant increase in the number of PCNA+ cells compared to WT. b The number of DCX+ cells was not changed between WT and APP-PS1 mice in any age group; however, both showed decreased DCX+ cell numbers with increased age. c The 3-month-old APP-PS1 mice had significantly elevated numbers of PCNA+/DCX+ cells compared to WT animals. This effect was limited to the early stage of Abeta pathology and was not seen in the 10- or 13-month-old animals. These proliferating DCX+ cells were mainly located in the SGCL and had small horizontal processes representing an immature neuroblast morphology (insert with arrow). d Analysis of Nestin+ stem cells and PCNA+/Nestin+ stem cells specifically in 3-month-old animals showed no changes in the Nestin+ stem cell pool of APP-PS1 animals compared to WT. e Analysing the Tg2576 mouse model at early stages of pathology confirmed the findings in the APP-PS1 mouse model. At 3 months of age, the Tg2576 mice showed significantly increased numbers of PCNA+ cells and significantly increased numbers of PCNA+/DCX+ cells compared to WT mice. However, these changes were diminished in 5-month-old Tg2576 animals. The number of DCX+ cells was not changed in 3- and 5-month-old Tg2576 compared to age-matched WT animals. NeuN was used to stain granular mature neurons and DAPI was used as nucleus stain. Two-way ANOVA with Tukey’s multiple comparisons test was performed (a, b, c, e, n = 6/group; d, n = 5/group). Scale bar 100 μm (a, b, c, d)

