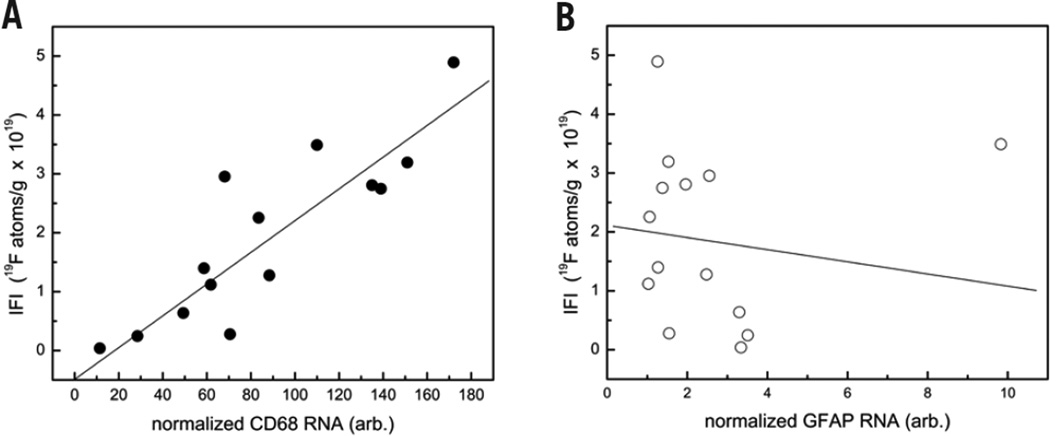
Figure 4. Quantitative analysis of macrophage burden in EAE spinal cord tissue using real-time PCR in a single rat.
(A) Correlation between IFI, obtained from 19F NMR, and CD68 mRNA levels. Data shows a linear correlation (R = 0.89), consistent with the PFC internalization into macrophage. The mRNA levels are normalized to gapdh. (B) Plot of IFI versus GFAP mRNA shows no correlation (R = −0.13), suggesting that PFC is not taken up by astrocytes.

