. 2015 Dec;136(6):e1495–e1503. doi: 10.1542/peds.2015-2093

FIGURE 3.

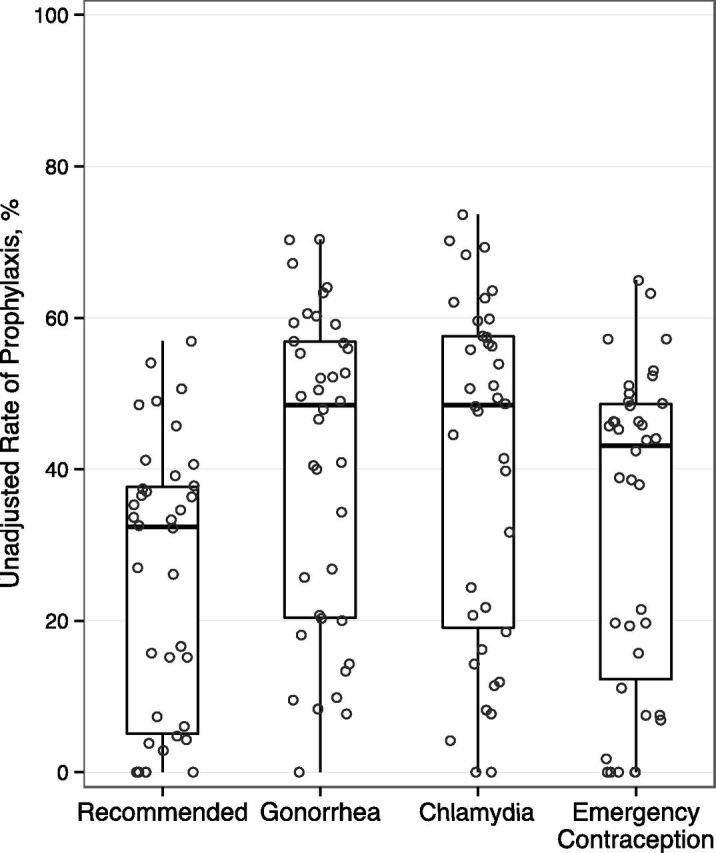
FIGURE 3. Variation in percentage of adolescents receiving prophylaxis across hospitals. Circles represent the rate of prophylaxis at each hospital. Box plots summarize the distribution across hospital: median, interquartile range (25th and 75th percentiles), and range (minimum and maximum). Recommended prophylaxis included treatment of gonorrhea and chlamydia in all patients and emergency contraception in female patients.

Variation in percentage of adolescents receiving prophylaxis across hospitals. Circles represent the rate of prophylaxis at each hospital. Box plots summarize the distribution across hospital: median, interquartile range (25th and 75th percentiles), and range (minimum and maximum). Recommended prophylaxis included treatment of gonorrhea and chlamydia in all patients and emergency contraception in female patients.