
Figure 2. T cell infiltration in five ovarian carcinomas.
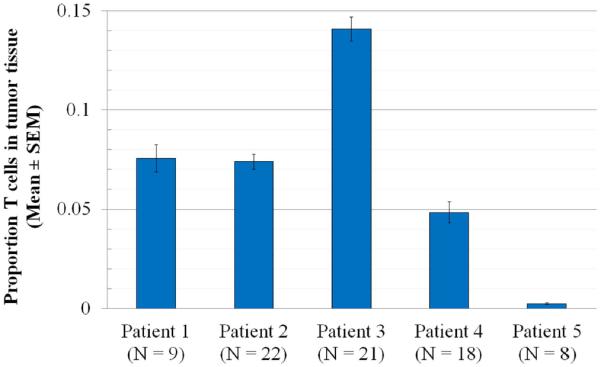
We used a droplet digital PCR assay to determine the level of T cell infiltration in patient samples. Among tumor tissue samples from the major site of each patient's malignancy (primary tumor in patients 2 and 5; metastatic tumor in patients 1, 3 and 4), we calculated the proportion of T cells for each patient among nucleated cells (mean ± SEM; N= the number of different tissue cores examined for each patient). With the exception of patients 1 and 2, whose tumors have very similar T cell numbers, each pair of tumors has significantly different level of T cell infiltration (n = 9 pairwise comparisons, p < 0.01 by two-tailed T test in each case).