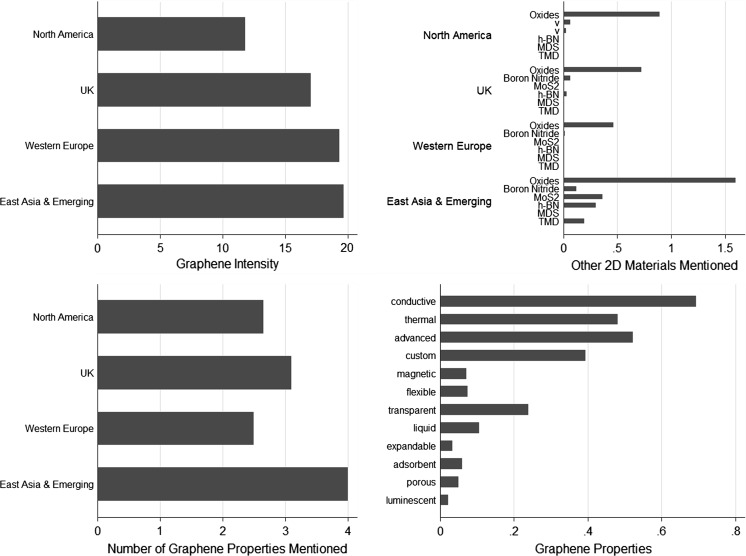
Fig. 3.
Graphene intensity, graphene properties, and other 2D materials.
Source Web mining analysis of 65 graphene small and medium-sized enterprises (SMEs) in study data set. X-axis is normalized scale per 1000 words. Top left diagram shows the relative intensity of mention of graphene (based on normalized mentions per 1000 words). Top right diagram shows the mention other two-dimensional (2D) materials (based on normalized mentions per 1000 words). Bottom left diagram shows the average number of mentions of graphene properties. Bottom right diagram shows the average number of graphene properties mentioned. See text for additional details

