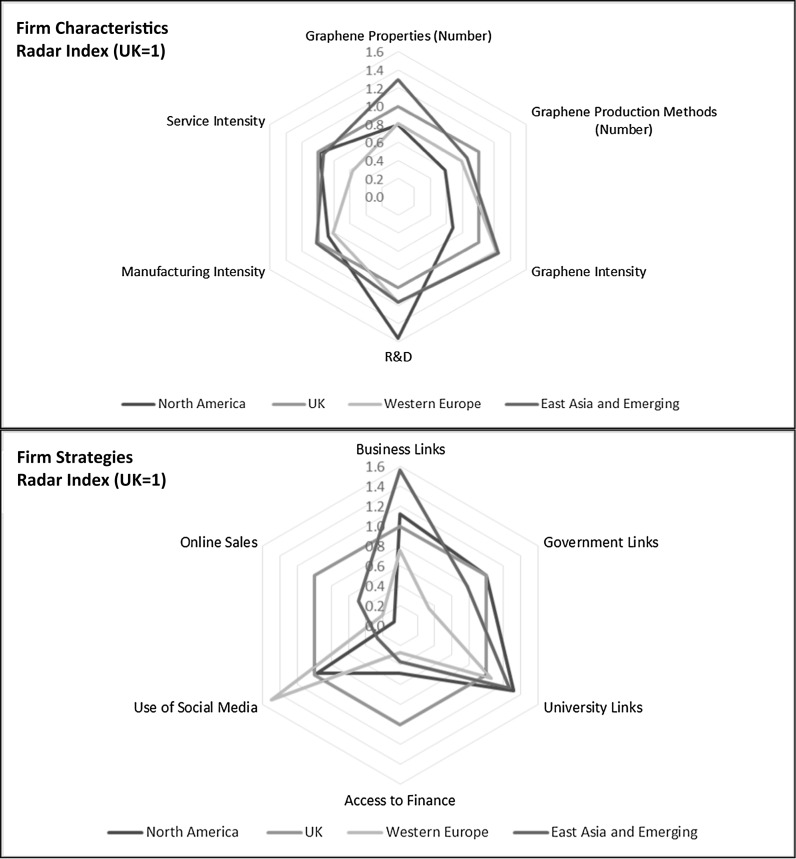
Fig. 5.
Graphene SME characteristics and strategies—comparative analysis by regions.
Source Web mining analysis of 65 graphene small and medium-sized enterprises (SMEs) in study data set. Normalized to UK = 1. The top radar diagram plots the values for mentions of R&D, graphene intensity, service and manufacturing intensity, number of graphene production methods, and number of graphene properties for each region. The bottom radar diagram plots the values for mentions of business relationships, links to governments and universities, access to finance, online sales, and use of social media for the four major regions. See text for additional details

